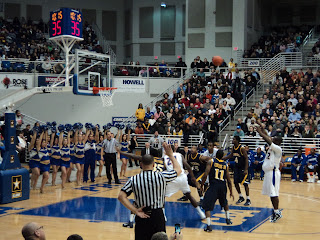
One of those teams in his series was Hofstra. In his Hofstra Team Similarity, John states that Ken Pomeroy's "luck metric" notes that "Hofstra was the sixth luckiest team in basketball last season according to his metric which compares pythagorean record to actual record." Furthermore Pomeroy's statistic says that Hofstra won four more games than they should have. And based on John's team similarities, of the five teams in recent history that were most similar, only the 2006-07 Wisconsin Green Bay team was more than one game above .500 (18-15).
Now for the few, the proud, the readers of my site, you know I am not the biggest fan of Ken Pomeroy's statistics. In my April 9 article called "NCAA Double Standards and Basketball People", I took issue with some of Pomeroy's ratings, specifically when it came to both Virginia Tech and Maryland. So this is not the first time I am disagreeing with a Pomeroy metric.
Having become friendly with John via Twitter, we went back and forth on the Hofstra article and I told him that I was going to do a little statistical research of my own. Teams play well often due to the less glamorous stats, like ball possession and free throws. I told John that I thought it was mainly due to Hofstra's very good assists to turnover ratio this past season. But I decided to dig a little deeper and did some research on three categories that might explain why Hofstra was 21-12 (well other than Charles Jenkins of course).
| Team | Record | APG | TPG | FT % | Record 7 Pts or less Margin |
| 2010-11 Hofstra | 21-12 | 14 | 10 | 76.1 | 9-4 |
| 2006-07 Wisc Green Bay | 18-15 | 11 | 12 | 76.0 | 3-3 |
| 2009-10 Stanford | 14-18 | 13 | 12 | 66.4 | 5-6 |
| 2006-07 Rider | 16-15 | 14 | 14 | 71.9 | 8-5 |
| 2005-06 Utah Valley State | 16-18 | 14 | 12 | 70.3 | 7-4 |
| 2009-10 Montana State | 15-14 | 13 | 11 | 68.8 | 8-7 |
As you can see from the above table, when you do the math, Hofstra (13.6 assists per game) had the best assists to turnover ratio of the six teams listed. In fact, the Pride led the CAA in assist to turnover ratio with a 1.3 ratio and had the fewest turnovers in the CAA, 342 . Hofstra also had the best free throw percentage of the six teams listed. Only VCU made more free throws in the CAA this past season than Hofstra. Finally, of the teams listed above, the Pride had the best record in games decided by seven points or less, along with having the most wins in those games.
Finally, including their quarterfinal win over William and Mary, Hofstra was 11-0 in vs. teams below .500 in the CAA. George Mason was the only other CAA team above .500 that accomplished that feat this past season. Beating the teams that you're supposed to beat is a very important factor in conference play, especially in such a competitive conference like the CAA.
John also noted in a tweet to me though that he couldn't statistically prove it, he thought having a go-to guy helps. Now I certainly agree with John's statement because Jenkins was dominant this season and certainly it could be said based on John Hollinger's Player Efficiency Ratings, Luke Winn's statistical analysis and even my own article that he was one of the most important players to his team in the country.
Also, two of the teams that Hofstra was compared in John's similarities had go-to guys that have eventually had successful NBA careers - 2006-07 Rider had Jason Thompson (20.1 ppg) and 2009-10 Stanford had Landry Fields (22.3 ppg). So those comparisons bode well for Jenkins, the recent second round pick of the Golden State Warriors.
But in fairness to the Pride, Jenkins was the go to guy in his two previous seasons at Hofstra as well. And one could argue that the Pride had as much talent in those two previous seasons as he did this past season. But those Hofstra teams were nowhere near as successful in conference those two seasons (10-8 in 2009-10 and 11-7 in 2008-09) and did not make it past the CAA Quarterfinals in either season.
A lot of that had to do with assists to turnover ratio. In 2009-10, Hofstra's was sixth in the CAA in assists to turnover ratio at 1.0 and in 2008-09, the Pride was last in the CAA with a .7 assists to turnover ratio. Hofstra was also third this past season in the CAA in turnover margin (+2.29). In their two previous seasons, the Pride had a negative turnover margin; - .24 in 2009-10 and -1.38 in 2008-09 which was last in the CAA.
So to paraphrase Ross Perot, charts and stats don't lie. Hofstra's success was based on a lot of statistical categories, especially when it came to assists to turnover ratio and turnover margin. That's how Hofstra won 21 games and finished third in a very competitive and talented CAA with a 14-4 conference record.
That has to do with skill and talent folks, not luck.


No comments:
Post a Comment